Creative Fatigue in Lead Ads: How to Spot It by Cost per Qualified Lead
Cost per lead can sit still long after a creative has worn out. How to spot fatigue by week-over-week cost per qualified lead, and what not to mistake for fatigue.
On this page
Creative fatigue is when the same ad performs worse and worse because the audience has already seen it many times. Meta describes it in similar terms in its creative fatigue recommendations for Ads Manager: an audience seeing the same creative too often. In sales campaigns, fatigue shows up as a rising cost per purchase. Lead ads are harder, because the cost per form can look fine long after the creative has worn out.
Why cost per lead isn't enough
A lead ad set is usually optimised for a submitted form. The delivery system looks for people who will fill it in. It doesn't know what happens next: whether your sales rep got through, whether the person remembers signing up, whether they bought.
So cost per lead (CPL) and lead quality don't have to move together. The cost per form can stay where it is while the share of leads you can actually work with goes down. From Ads Manager's point of view the creative looks healthy. From your sales team's point of view, things keep getting worse.
You'll only see that drop in your own stages. That's the idea behind measuring creative fatigue in lead ads with cost per qualified lead: spend divided by the leads your team judged worth pursuing.
Example: flat cost per lead, rising cost per qualified lead
Example data, one video creative, six consecutive weeks:
| Week | Spend | Leads | Cost per lead | Qualified | Cost per qualified | Hook rate |
|---|---|---|---|---|---|---|
| 1 | Spend$1,400 | Leads56 | Cost per lead$25 | Qualified10 | Cost per qualified$140 | Hook rate24% |
| 2 | Spend$1,400 | Leads58 | Cost per lead$24 | Qualified10 | Cost per qualified$140 | Hook rate24% |
| 3 | Spend$1,500 | Leads61 | Cost per lead$25 | Qualified11 | Cost per qualified$136 | Hook rate23% |
| 4 | Spend$1,500 | Leads60 | Cost per lead$25 | Qualified10 | Cost per qualified$150 | Hook rate23% |
| 5 | Spend$1,500 | Leads62 | Cost per lead$24 | Qualified7 | Cost per qualified$214 | Hook rate21% |
| 6 | Spend$1,500 | Leads60 | Cost per lead$25 | Qualified5 | Cost per qualified$300 | Hook rate20% |
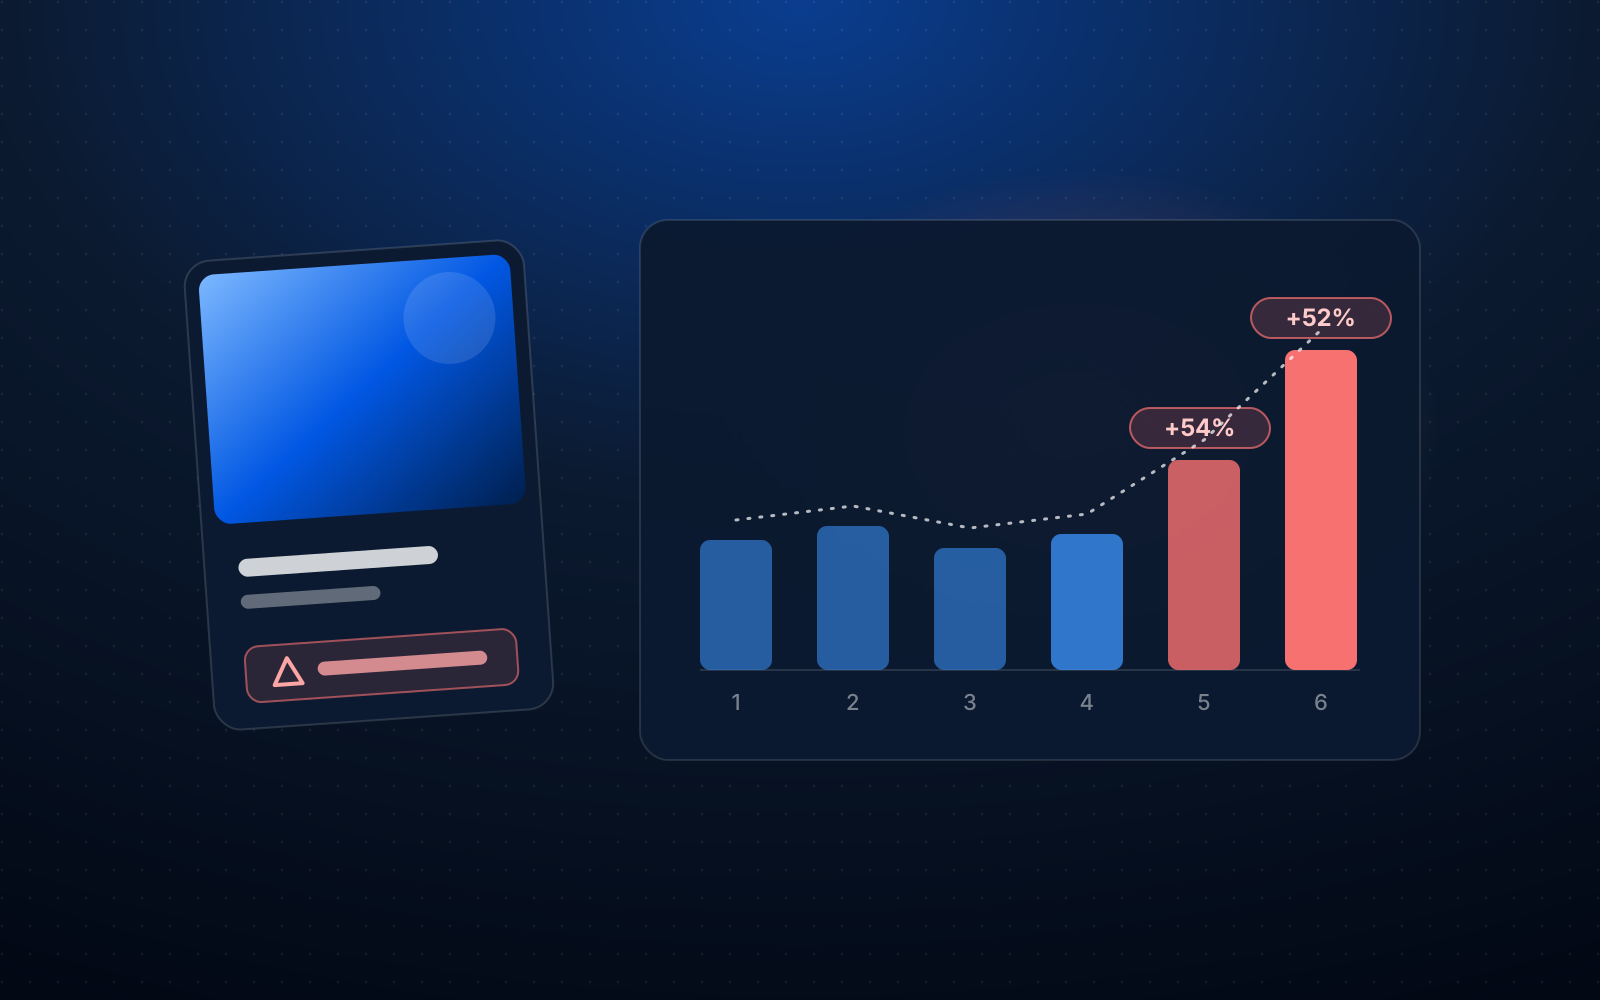
Cost per lead barely moves in six weeks. Cost per qualified lead jumps 43% in week five and another 40% in week six. Hook rate slips slowly, not sharply. Looking only at Ads Manager, you'd leave this creative alone.
How to build a signal that doesn't cry wolf every week
Cost per qualified lead is noisy by nature. With ten qualified leads a week, one fewer raises the cost by more than 10%. React to every increase and you'll be swapping creatives weekly. A good signal needs a few safety catches:
- Weekly windows. Days are too random. A week evens out weekdays and weekends.
- Two increases in a row. One bad week is often chance. Two consecutive increases by a clear margin make a pattern.
- A minimum increase. A 5% rise is within the noise. A threshold around 30% catches changes that actually matter for your budget.
- Minimum spend. A creative that got a few dozen dollars in a week can't produce a reliable cost. Skip low-spend weeks.
- A starting point with a result. To talk about an increase, the first week needs at least one qualified lead. A week with spend and no qualified leads at all is a cost that could only have gone up.
In the example above, weeks 4, 5 and 6 meet every condition. For comparison, example data for a different creative:
| Week | Spend | Qualified | Cost per qualified |
|---|---|---|---|
| 4 | Spend$1,500 | Qualified10 | Cost per qualified$150 |
| 5 | Spend$1,500 | Qualified7 | Cost per qualified$214 |
| 6 | Spend$1,500 | Qualified9 | Cost per qualified$167 |
One spike and back down. That's not fatigue, just ordinary variance.
What else can look like fatigue
A rising cost per qualified lead is a symptom, not a diagnosis. Before you blame the creative, check:
- The learning phase. Meta treats some ad set changes, including changes to the audience, creative or optimisation event, as a significant edit that can restart the learning phase. An ad set that doesn't get around 50 optimisation events in the week after such a change is marked Learning limited. Results from that period are less stable.
- Budget and audience. Raising the budget or narrowing the audience changes who sees the ad.
- Frequency. Meta reports frequency as the estimated average number of times each person saw your ad. If it climbs along with the cost, "the audience has had enough" becomes more likely. If it's flat, look elsewhere.
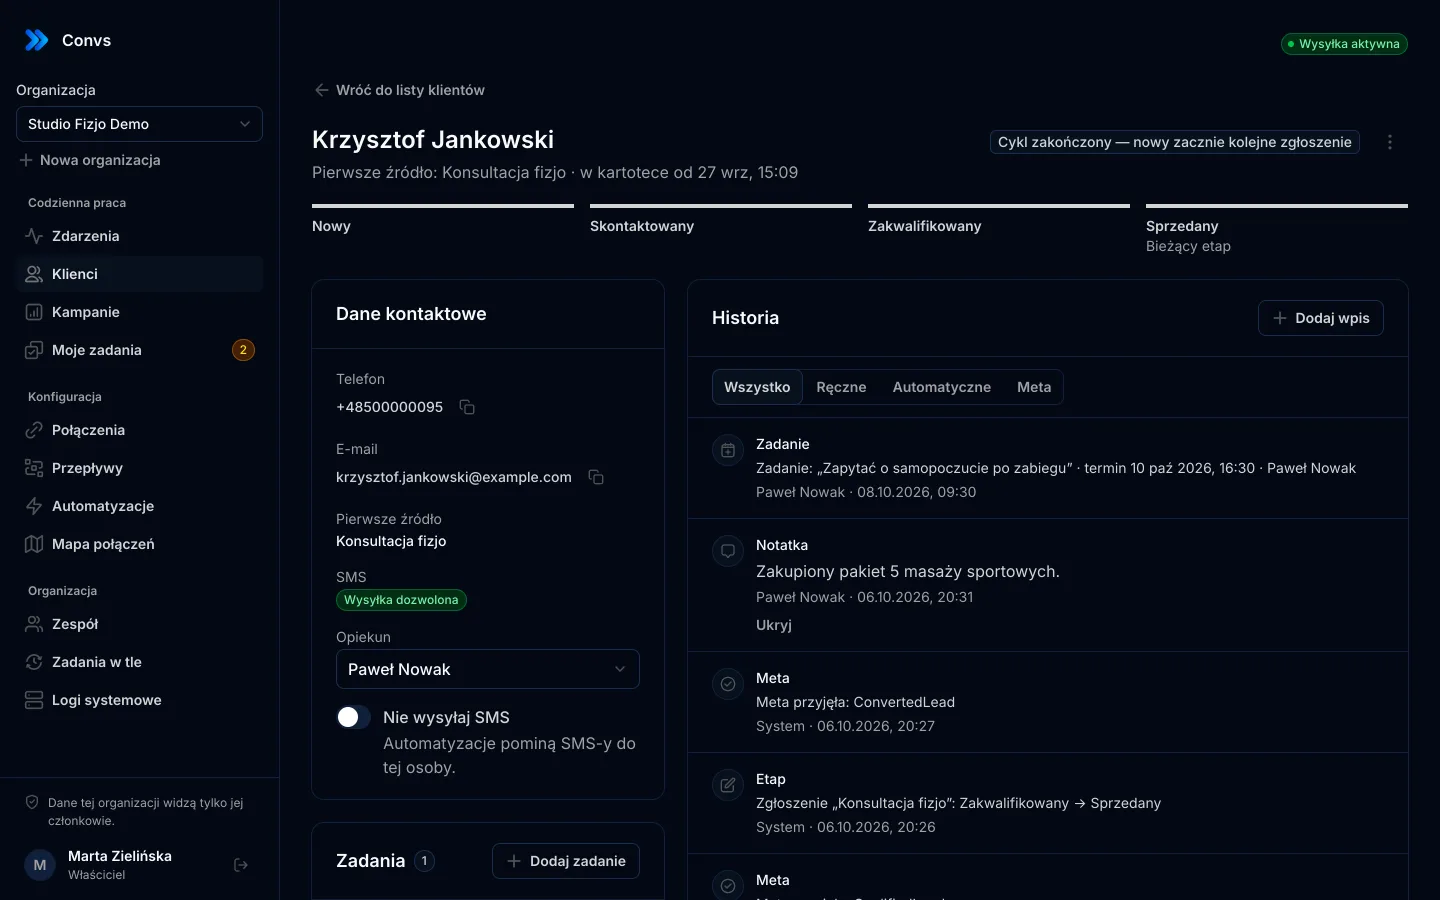
- Your sales team. When reps qualify more slowly, because of holidays or a surge of leads from another source, cost per qualified lead rises with no change to the ad. More on clean stages in CRM lead stages for Meta.
- Fresh leads. When you count cohorts by submission date, the latest week is always incomplete. Some of its leads haven't been qualified yet. If your team qualifies within a day or two, that's a detail. If it takes two weeks, the latest week will always look "fatigued".
- Season and offer. The end of a promotion, a price change or a slow buying season hits every creative at once. If costs rise across all your creatives, it's probably not one of them wearing out.
The simplest test: compare the suspect creative with the others in the same ad set over the same weeks. If only that one is getting more expensive, the signal is stronger.
Hook rate as a second signal
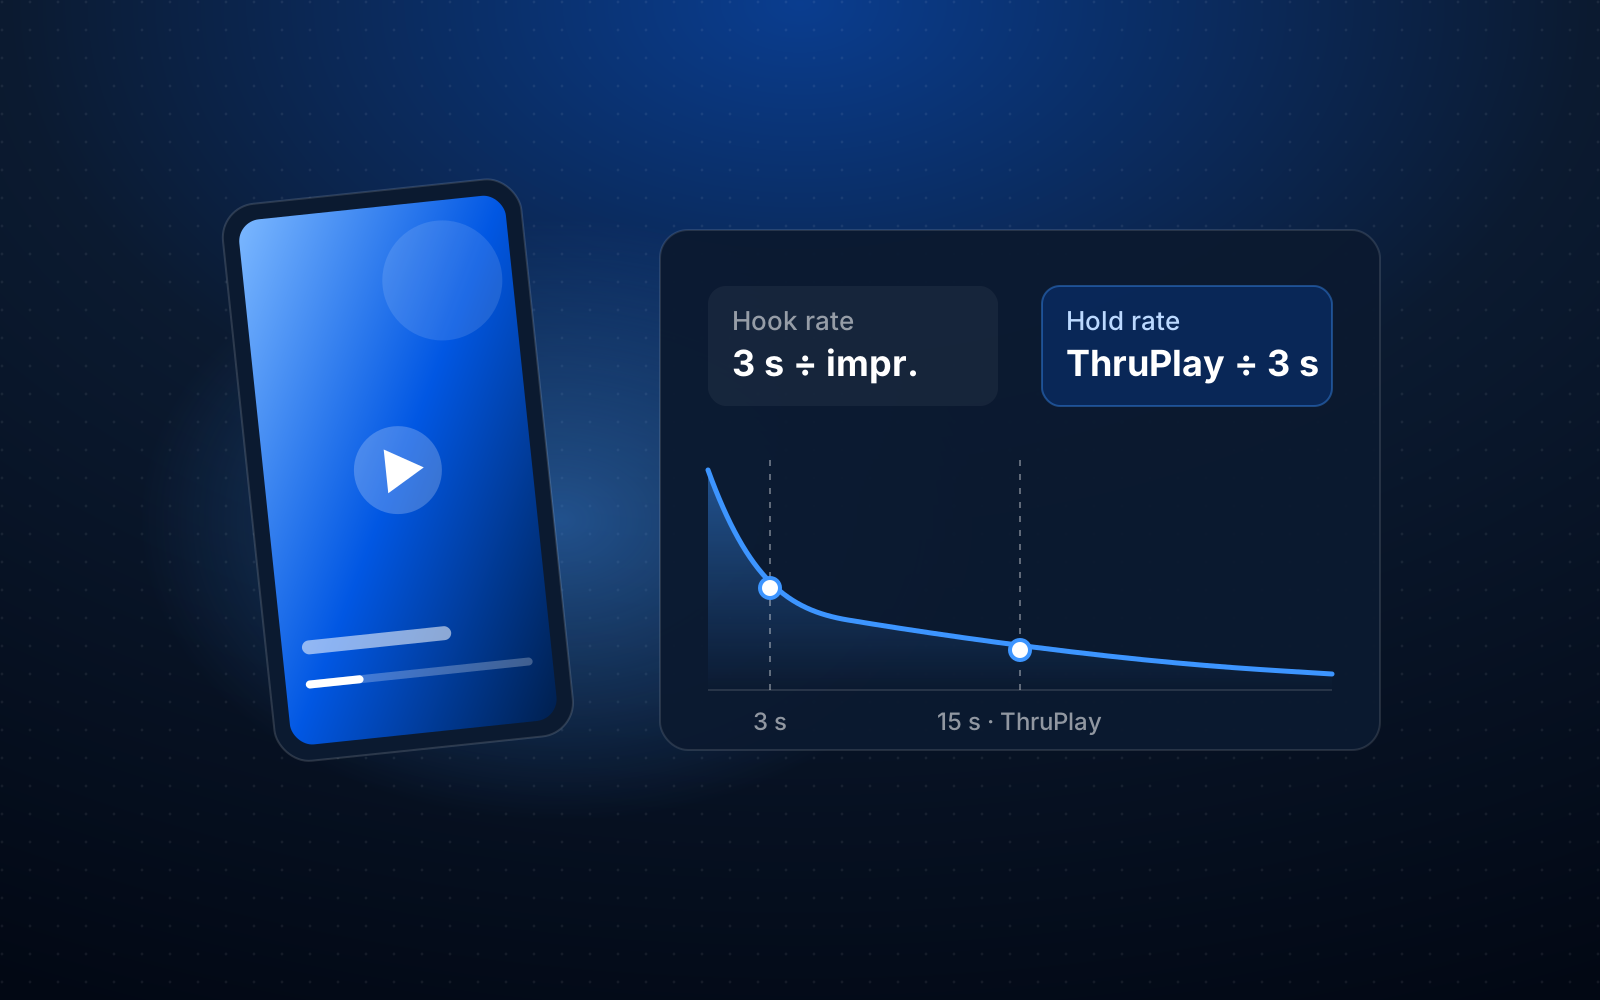
In video, fatigue often starts at the opening. People who have seen the ad a few times scroll past faster. That shows in hook rate, meaning 3-second plays divided by impressions.
A falling hook rate is an earlier signal but a weaker one. It says fewer people stop, not that worse customers come in. Treat it as a second indicator: two consecutive drops of at least 20% are a reason to look, and together with a rising cost per qualified lead they're a strong hint.
What to do when the signal appears
- Go through the list above. Ad set changes, budget, frequency, the sales team, fresh leads.
- Keep what works. If the offer and the audience are fine, a new opening or a new creator on the same offer is often enough.
- Look at your tags. If you tag creatives, for example by hook, creator, offer and format, you'll see whether one type of opening is wearing out or everything with a given creator.
- Don't switch everything off at once. Replacing a creative can itself be a significant edit. Add the new version alongside and compare both over a few weeks.
- Write the decision down. In a month it's much easier to judge whether the refresh helped when you know when and why you made it.
How it looks in Convs
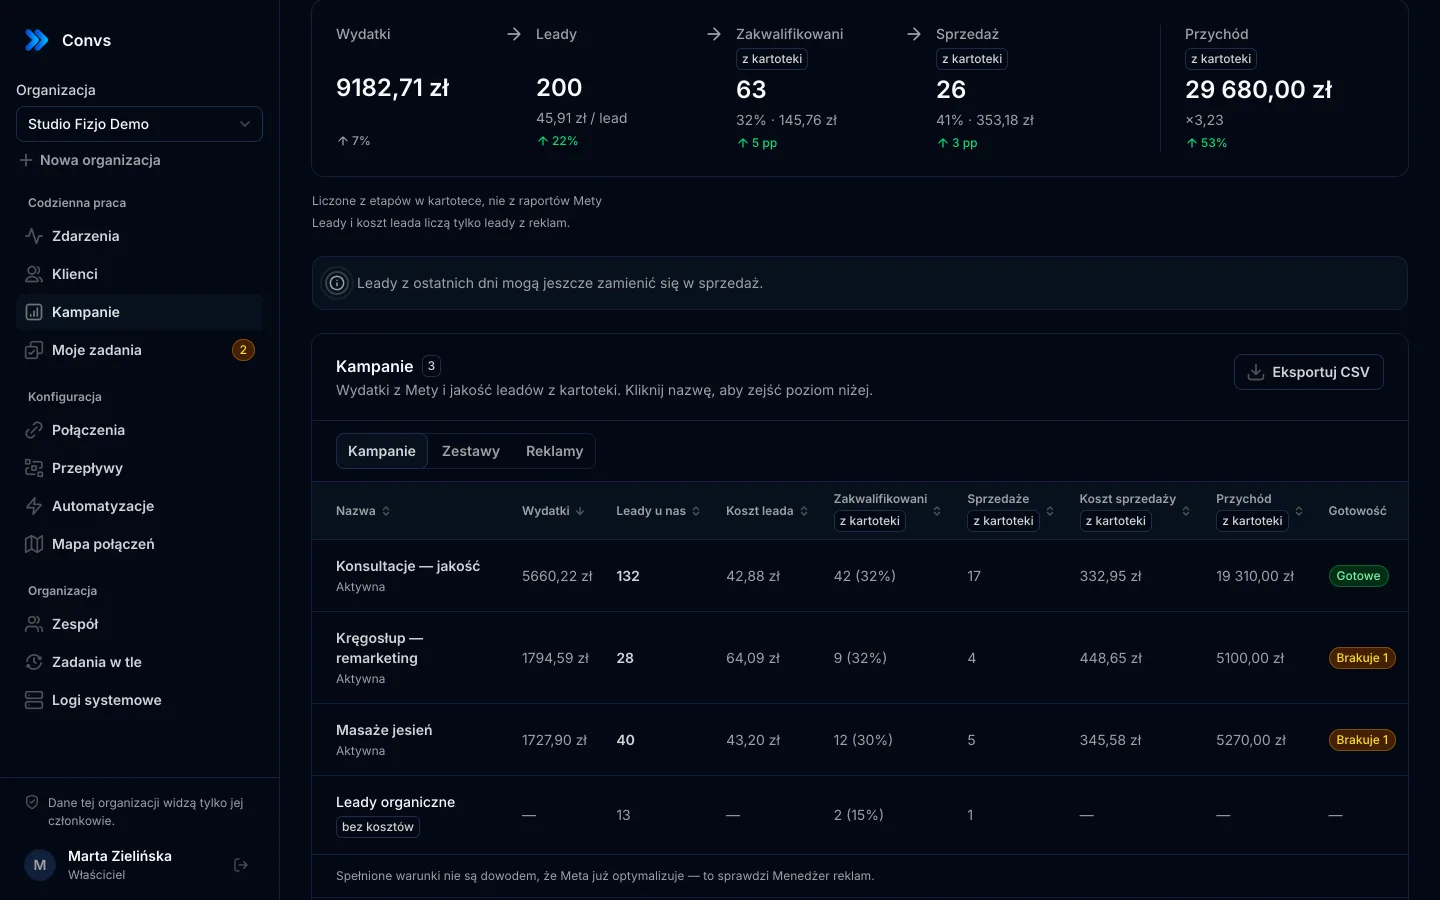
The Creatives page in Convs calculates cost per qualified lead week by week for every creative and shows two signals:
- "Possible fatigue": over the last 3 weeks, spend of at least 100 in the account currency every week, and cost per qualified lead up by at least 30% twice in a row. The first of those weeks needs a qualified lead, and a week with spend but no qualified leads counts as an increase.
- "Hook rate drop": hook rate at least 20% lower than the week before, two weeks in a row.
Weeks are seven-day windows counted back from the end of the selected period. Spend, impressions and video data come from Meta (read-only, the ads_read permission), while leads, qualifications and sales come from your CRM, by submission date, with a sale counted once per person and cycle. Ads that use the same video or image are one creative, so the signal describes the asset as a whole, not a single ad.
Next to it you see leads reported by Meta and leads that actually reached the CRM, and you can compare 2 to 4 creatives side by side, tag them, check the breakdown by tag or export the data to CSV. The app labels the fatigue signal plainly: a reason to check, not proof of cause. More on the creative analytics page.
Next step
Pick the longest-running creative in your account and lay out its cost per qualified lead for the last six weeks. If you see two clear increases in a row at similar spend, work through "what else can look like fatigue" before you switch anything off. If you run campaigns for several clients, the same review rhythm fits well into agency reporting.
Frequently asked questions
How do I recognise creative fatigue?
The same creative, at similar spend, gets more expensive results for several weeks in a row. In lead ads the clearest measure is cost per qualified lead tracked week by week. Frequency and hook rate are useful supporting signals.
Why isn't cost per lead enough?
Because Meta optimises delivery for the event you chose, usually a submitted form. The cost of a form can stay flat while the quality of sign-ups drops. You only see that drop in your CRM stages.
How many weeks of increases count as fatigue?
Meta doesn't publish a universal threshold. A sensible rule is at least two consecutive increases by a clear margin, say 30%, at spend high enough that a single lead doesn't swing the result. One bad week is more often noise than fatigue.
What else can look like fatigue?
A new learning phase after a big change to the ad set, a budget or audience change, seasonality, a slower sales team, and recent leads that haven't been qualified yet. Rule these out before you replace the creative.
Does a fatigue signal mean I should switch the ad off?
No. It's a prompt to take a look: compare the creative with others in the same ad set, check frequency and the change history. A new opening or a new version of the same offer often works better than switching everything off at once.