Hook Rate and Hold Rate in Meta Ads: How to Calculate Them and What They Really Mean
Hook rate and hold rate aren't Meta metrics, just simple ratios of Meta's numbers. How to calculate them, where they mislead, and why they say nothing about lead quality.
On this page
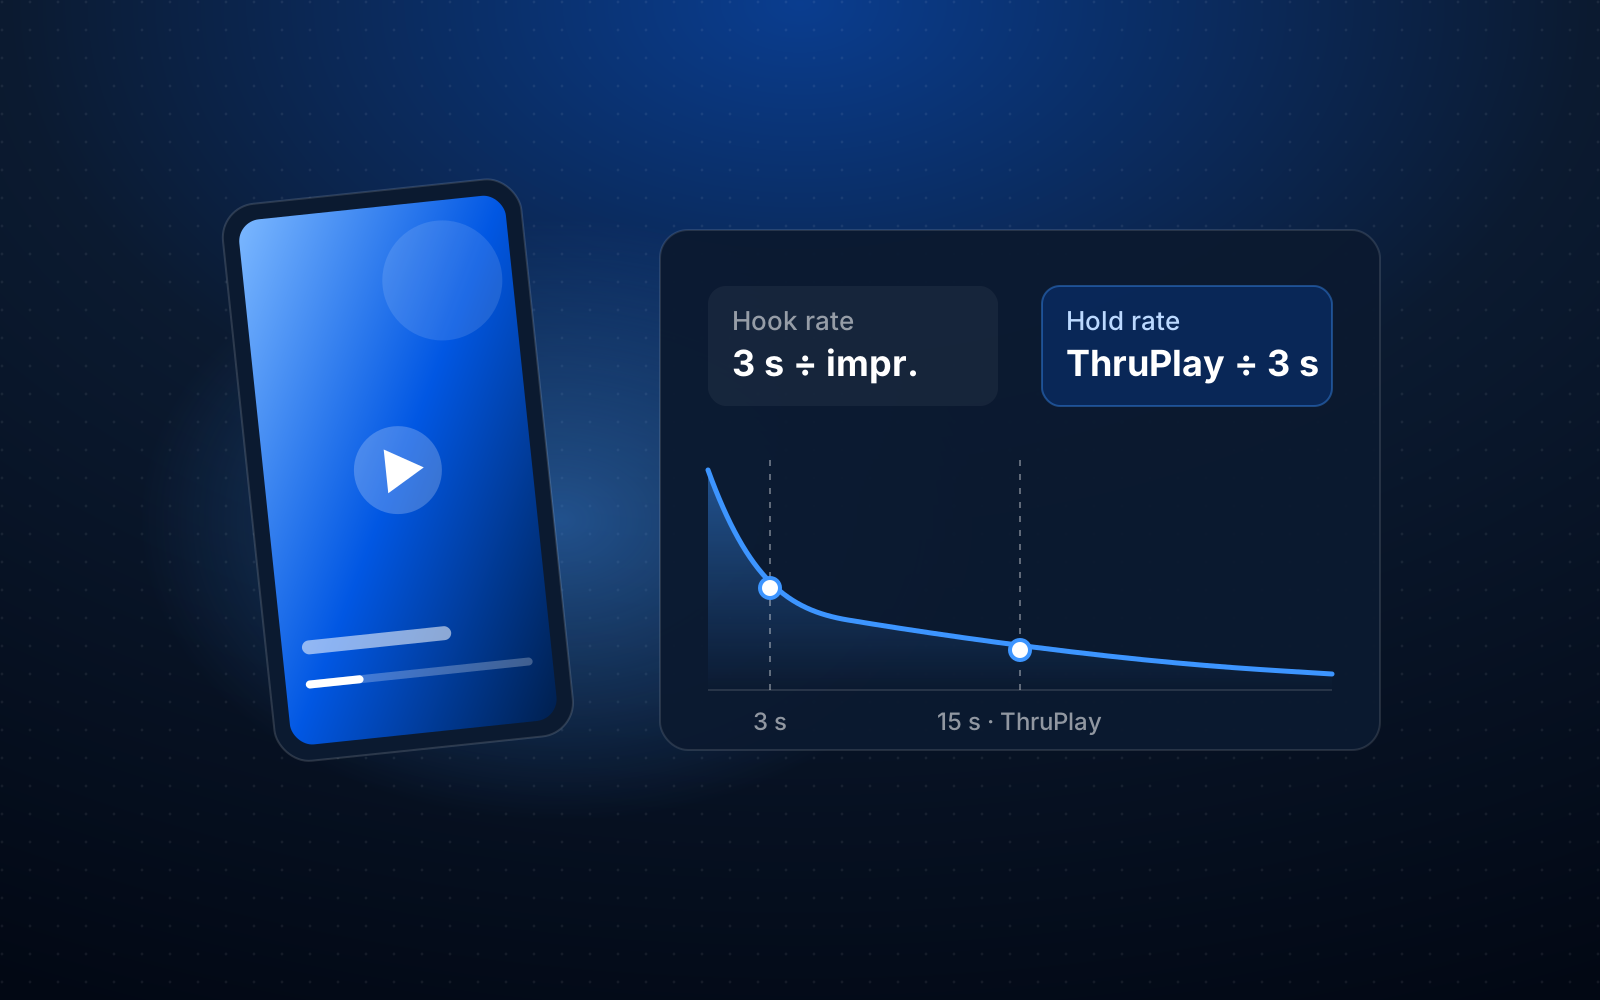
Hook rate and hold rate are two simple ratios creative teams use to describe video in Meta ads. Hook rate tells you what share of impressions turned into at least 3 seconds of viewing. Hold rate tells you how many of those people stayed longer, until a ThruPlay. Neither is a Meta metric. Meta reports the raw counts, and you, or your tool, do the division.
Where the numbers come from
Every ingredient is in Ads Manager and in the Insights API. It's worth knowing how Meta defines each one, because that decides what you're actually comparing.
| Meta count | API field | What Meta says it means |
|---|---|---|
| Impressions | API fieldimpressions | What Meta says it meansthe number of times your ads were on screen |
| 3-second plays | API fieldactions with type video_view | What Meta says it means"3-Second Video Views" |
| ThruPlays | API fieldvideo_thruplay_watched_actions | What Meta says it meansat least 15 s, or 97% of a video shorter than 15 s |
| 25–100% plays | API fieldvideo_p25_watched_actions … video_p100_watched_actions | What Meta says it meansplays reaching that share of the length, including skips |
| Link clicks | API fieldinline_link_clicks | What Meta says it meansclicks on links to selected destinations |
The AdsActionStats reference names the video_view action type "3-Second Video Views". The ThruPlay definition is in the Meta Business Help Center: someone watches at least 15 seconds of the video, or 97% of a video shorter than 15 seconds. Rewinding and rewatching the same part doesn't count towards those 15 seconds.
Two details are easy to miss. Link clicks in the API use a fixed 1-day-click attribution window. And the 25–100% plays include people who skipped ahead to that point, so they aren't a clean start-to-finish retention curve.
The formulas
| Metric | Formula | The question it answers |
|---|---|---|
| Hook rate | Formula3-second plays ÷ impressions | The question it answersdoes the opening stop the scroll? |
| Hold rate | FormulaThruPlays ÷ 3-second plays | The question it answersdo the people who stopped keep watching? |
| Link CTR | Formulalink clicks ÷ impressions | The question it answersdoes the ad lead to action? |
This is a convention, not a standard. Some tools calculate hold rate as ThruPlays ÷ impressions, others use 15-second plays or 2-second continuous views. Before you compare a number from your agency's report with one from your own spreadsheet, check the numerator and the denominator. The gap between definitions can be bigger than the gap between creatives.
Example: two creatives, same budget
Example data, two video creatives in the same ad set, in the same week:
| Creative A | Creative B | |
|---|---|---|
| Spend | Creative A$2,000 | Creative B$2,000 |
| Impressions | Creative A40,000 | Creative B40,000 |
| 3-second plays | Creative A12,000 | Creative B7,200 |
| ThruPlays | Creative A3,000 | Creative B3,600 |
| Hook rate | Creative A30% | Creative B18% |
| Hold rate | Creative A25% | Creative B50% |
Creative A is great at stopping the scroll, but three in four viewers drop off before the 15-second mark. Creative B stops fewer people, but half of them stay. Which one is better? The video numbers alone can't tell you. We'll come back to this example below.
What hook rate tells you, and what it doesn't
Hook rate describes the first seconds well: the opening shot, the first line, the on-screen text. If you only change the opening of a video and keep the rest, comparing the hook rate of the two versions makes sense.
It gets shakier when you compare things that differ in more than the creative:
- Placement. People watch differently in Reels, Stories and Feed. If one creative ran mostly in Reels and the other in Feed, you're comparing placements, not creatives. The Insights API lets you break results down by platform and position (
publisher_platform,platform_position). - Audience. Retargeting people who know your brand usually watches more willingly than cold traffic.
- Small samples. With a few thousand impressions, a few dozen plays either way moves the result by whole percentage points.
That's why there's no single "good hook rate". Figures in other people's posts come from other accounts, industries and placements. The most useful benchmark is your own creatives in similar campaigns over the same period.
Hold rate and video length
Hold rate has a trap built into the ThruPlay definition. For a video under 15 seconds, a ThruPlay means watching 97% of it. For a longer video, it means 15 seconds, whether the video runs 20 seconds or three minutes.
In practice:
- An 8-second video: hold rate is roughly the share of people who watched to the end.
- A 60-second video: hold rate is the share of people who watched the first quarter of a minute. It says nothing about the rest.
Only compare hold rates between videos of similar length. If you want to know where people drop off in a longer piece, look at the 25%, 50%, 75% and 100% plays, keeping in mind that Meta counts skips in those too.
Why this isn't enough for lead ads
Back to the example. Example data, same week, same creatives, this time with results from the CRM:
| Creative A | Creative B | |
|---|---|---|
| Leads | Creative A80 | Creative B50 |
| Cost per lead | Creative A$25 | Creative B$40 |
| Qualified leads | Creative A12 | Creative B15 |
| Cost per qualified lead | Creative A$167 | Creative B$133 |
Creative A has the better hook rate and the cheaper lead. Creative B delivers the cheaper qualified lead, meaning a cheaper conversation worth having. Judge creatives only by video metrics and Ads Manager's cost per lead, and you'd move budget the wrong way.
Video metrics are about attention. Who signs up and whether they buy is something only your CRM knows. So read hook rate and hold rate next to cost per qualified lead and cost per sale, not instead of them.
This isn't proof of cause either. Creative B may get better leads because its message puts off casual sign-ups, but it may just as well have reached a different slice of the audience. The comparison shows you where to look; it doesn't settle the argument.
How to read these numbers in practice
- Divide sums, don't average percentages. The hook rate of a creative running in five ads is the total 3-second plays divided by total impressions, not the average of five hook rates.
- Group ads that use the same video. The same video in three ad sets is one creative. Looking at each ad separately splits your sample and hides the pattern.
- Watch the week-over-week trend. A drop in the same creative's hook rate from one week to the next tells you more than a comparison with a different creative. We cover how drops connect to fatigue in the article on creative fatigue.
- Tag your creatives. Give each creative a hook, a creator, an offer and a format, and after a few weeks you'll see which kind of opening or which creator brings in cheaper good customers.
- Always add the CRM result. Without lead stages you don't know whether attention turns into customers.
How it looks in Convs
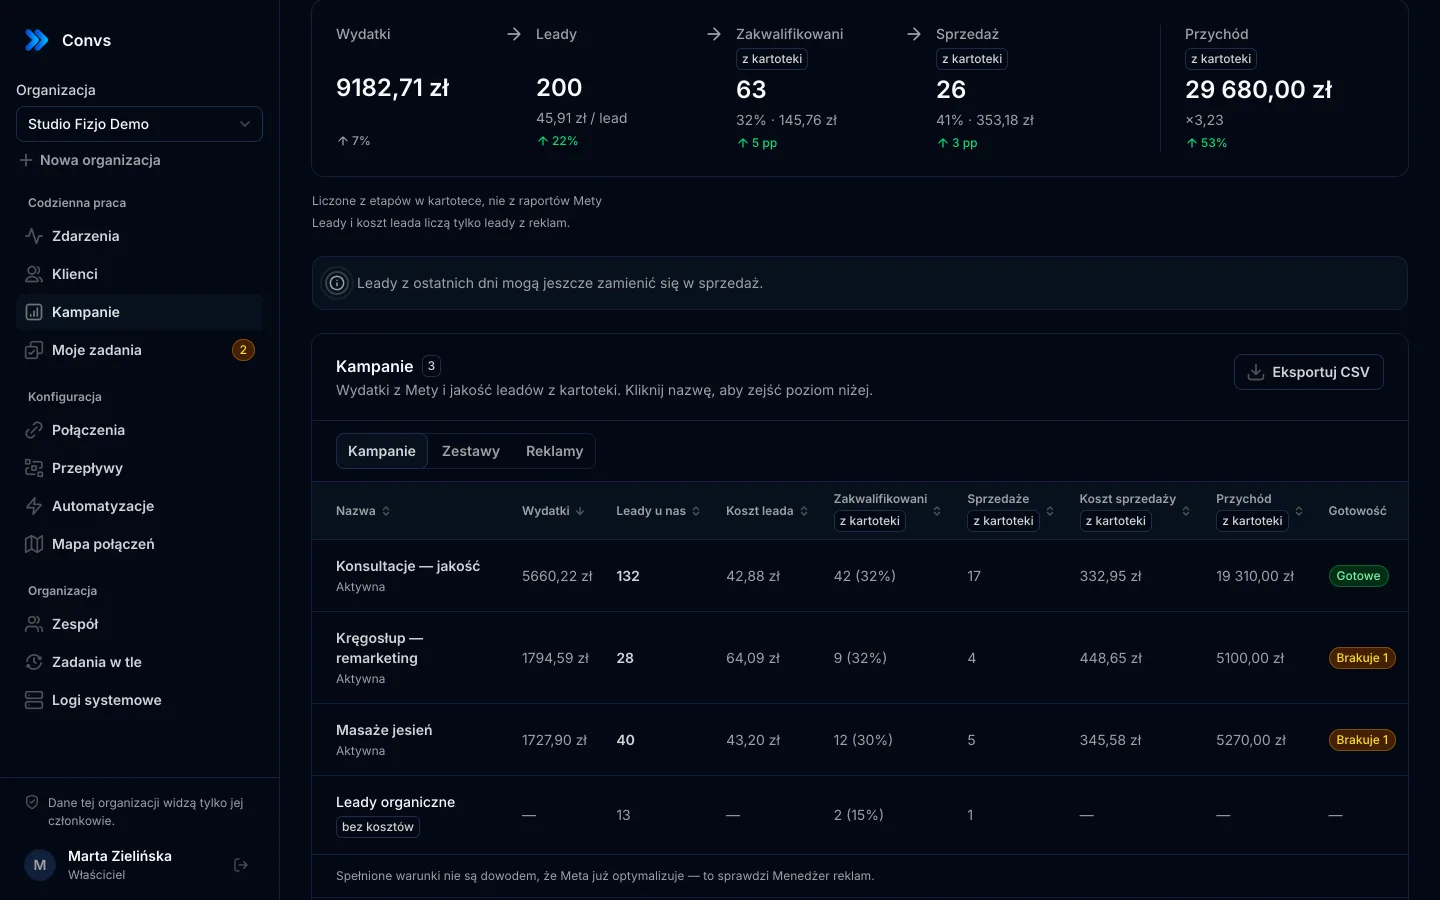
The Creatives page in Convs reads data from Meta read-only (the ads_read permission) and joins it with the stages in your CRM. For each creative you see:
- hook rate (3-second plays ÷ impressions), hold rate (ThruPlays ÷ 3-second plays) and link CTR (link clicks ÷ impressions), plus the 25–100% plays in the details;
- spend, cost per lead, cost per qualified lead and cost per sale calculated from CRM stages, and ROAS from CRM revenue only when the ad account and the sale use the same currency;
- leads reported by Meta next to leads that actually reached the CRM, with the gap highlighted;
- cost per qualified lead week by week, and a "Hook rate drop" signal when hook rate falls by at least 20% two weeks in a row.
Ads that use the same video or image count as one creative. Leads are assigned to a period by submission date, and a sale counts once per person and cycle. You can tag creatives by hand (hook, creator, offer, format), see a breakdown by tag, compare 2 to 4 creatives side by side and export everything to CSV. Images and photo carousels have no video metrics, because there are no plays. More on the creative analytics page.
Just like in Ads Manager, the numbers show relationships, not causes. A creative with a better result isn't necessarily the reason for it.
Next step
Take three video creatives from the last month, calculate hook rate, hold rate and cost per qualified lead for each, and put them in one table. If the ranking by hook rate differs from the ranking by cost per qualified lead, you have your answer to why both matter. If your CRM stages aren't ready for this kind of counting yet, start with the article on lead-quality optimisation.
Frequently asked questions
Is hook rate an official Meta metric?
No. Meta reports impressions, 3-second video plays and ThruPlays; hook rate and hold rate are ratios the industry builds from those numbers. That's why different tools can calculate them slightly differently. Always check what sits in the numerator and the denominator.
What is a good hook rate?
There's no single number that fits every account. Hook rate depends on placement, video length, audience and industry. Compare creatives within the same account, similar campaigns and the same period, not against a figure from someone else's post.
Why do short videos have a higher hold rate?
Because for a video under 15 seconds a ThruPlay means watching nearly to the end, while for a longer one it means watching 15 seconds. A 10-second video has a lower bar than a one-minute video. Only compare hold rates between videos of similar length.
Does a high hook rate mean cheaper leads?
Not necessarily. Hook rate tells you how many people stopped on the ad. Cost per lead, and even more so cost per qualified lead, also depends on the offer, the form and who signs up. A creative with a lower hook rate sometimes brings in cheaper good customers.
Does hook rate apply to image ads?
No. An image has no plays, so hook rate and hold rate only make sense for video. For images and photo carousels, look at link CTR and the costs from your CRM.